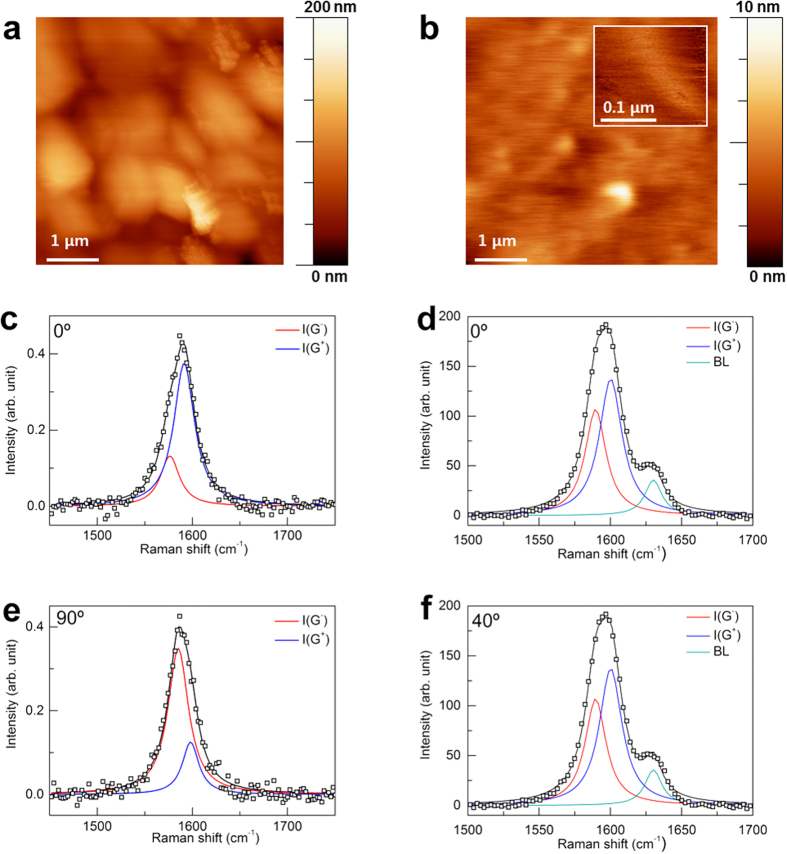
Figure 2. Atomic force microscopic images and polarized Raman spectra of EGBS.
Microscopy of (a) Si WF/Ni/MLG and (b) MLG/BL/PET measured over an area of 5 × 5 μm2. The inset shows the RMS roughness of BL/PET measured over an area of 0.2 × 0.2 μm2. The maximum value of the height scale bars are 200 nm (a) and 10 nm (b), and 10 nm (the inset of (b)). The intensity variation of G− and G+ peaks of Si WF/Ni/MLG at (c) 0° and (e) 90° of polarization angle of the incident laser. The intensity variation of G− and G+ peaks of MLG/BL/PET at (d) 0° and (f) 40° of polarization angle of the incident laser.

