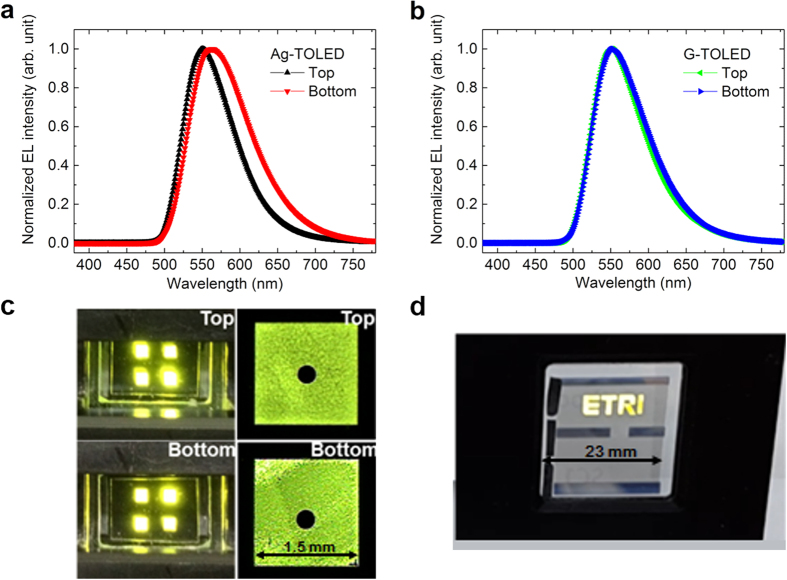
Figure 6. EL Spectra and photographs of TOLEDs.
Normalized top and bottom EL spectra of (a) the Ag-TOLED and (b) the G-TOLED, (c) top and bottom pixel images during operation with active size of 1.5 × 1.5 mm2 of a G-TOLED, (d) “ETRI” logo displayed from an OLED segment panel with an MLG top electrode (the area of MLG is 23 × 23 mm2).

