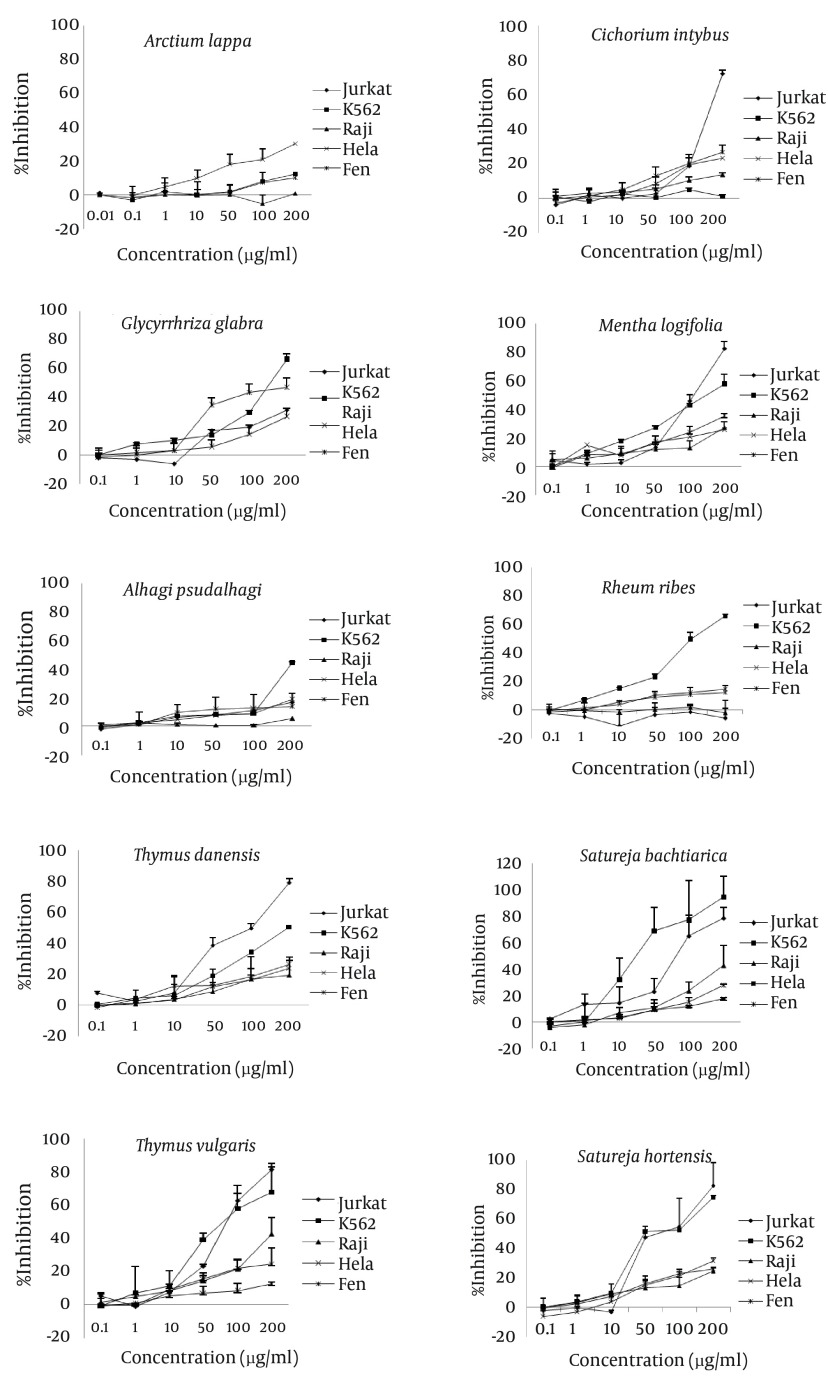
Figure 1. Effects of the Methanolic Extract of Various Medicinal Plants on Different Cell Lines Determined by MTT Colorimetric Assay.
Cells were treated with various concentrations of the extracts for 48 hours. Negative control was cells treated only with solvent (DMSO) at concentrations equal to test wells. Percentage inhibition was calculated according to the formula in the text. Values represent the mean ± standard deviation from three sets of independent experiments.

