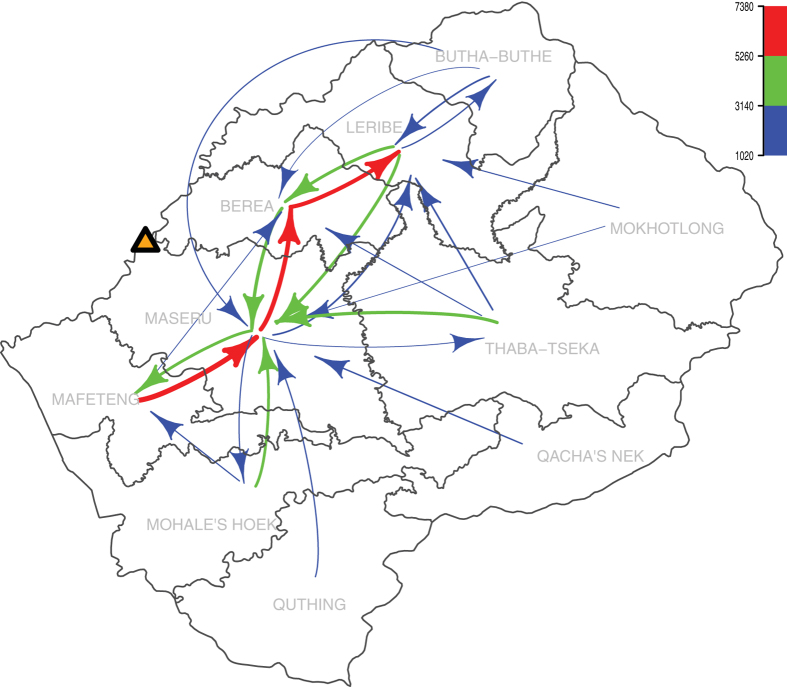
Figure 2. Map showing changes in permanent residency between 2001 and 2011.
Arrows show the number of individuals moving from one HCD to another. Arrow width is representative of the number of individuals moving. Movements of less than 1000 individuals are not show. The yellow triangle shows the location of the capitol city, Maseru. The figure was produced using the R package ‘diagram’30,31.

