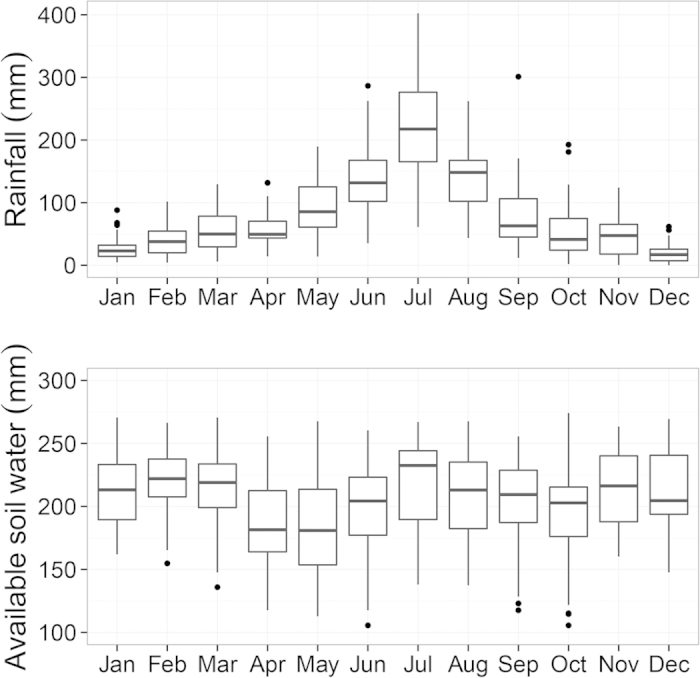
Figure 1. Distribution of monthly rainfall and available soil water in the top 2 meter during the period 1982–2012.

Available soil water is defined as the total soil water content minus the water content at wilting point. Boxes show the range between 25th and 75th percentile values, i.e. interquartile between Q1 (25th percentile) and Q3 (75th percentile). Lines in the boxes show the median values. Whiskers show the range of Q1 − 1.5 interquartile at the bottom, and Q3 + 1.5 interquartile at the top. Dots are the outliers beyond the range of Q1 − 1.5 interquartile and Q3 + 1.5 interquartile.
