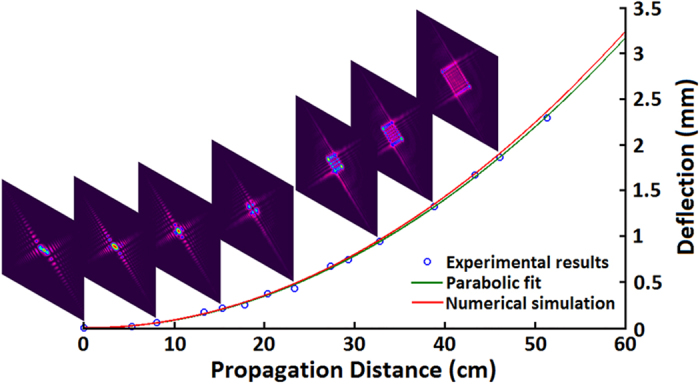
Figure 5. Transverse acceleration.

Transverse acceleration of Airy beam as a function of propagation distance. Blue circles mark the experimental results with some images inserted accordingly. The green line is the parabolic fit while the red line is the numerical simulation.
