
Figure 2. Phylogenetic analysis of the NA segment (positions 25–1375) of H9N2 avian influenza viruses compared to reference influenza viruses.
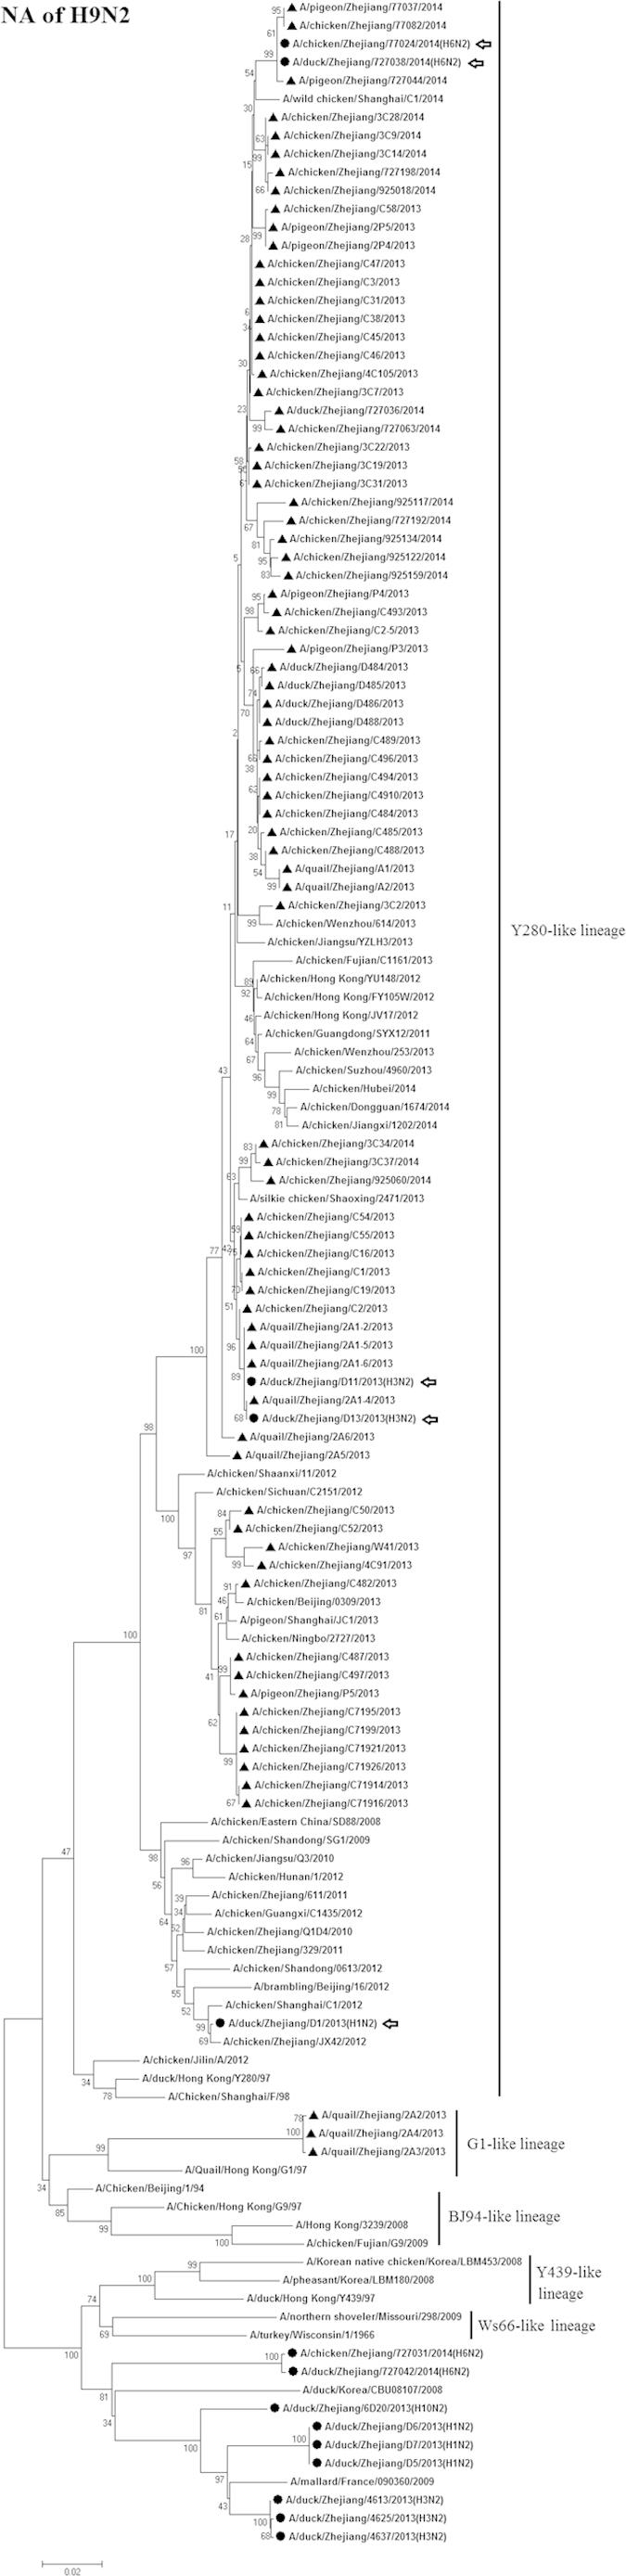
The tree was created by the maximum likelihood method and bootstrapped with 1,000 replicates using the MEGA6 package. Chinese avian influenza viruses from poultry in this study are highlighted by triangles. Scale bar represents the distance unit between sequence pairs. The arrows indicate reassortments between H9N2 and other avian influenza viruses.