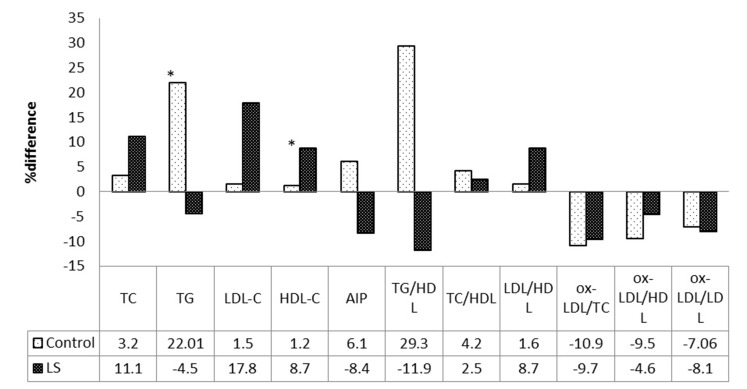
Fig. 2.
Mean differences of variables compared with baseline values in two groups (*significant difference within the groups using paired t-test, P<0.05).TC, total cholesterol; TG, triglyceride; LDL-C, low density lipoprotein; HDL-C, high density lipoprotein; ox-LDL, oxidized- low density lipoprotein; AIP, atherogenic index of plasma

