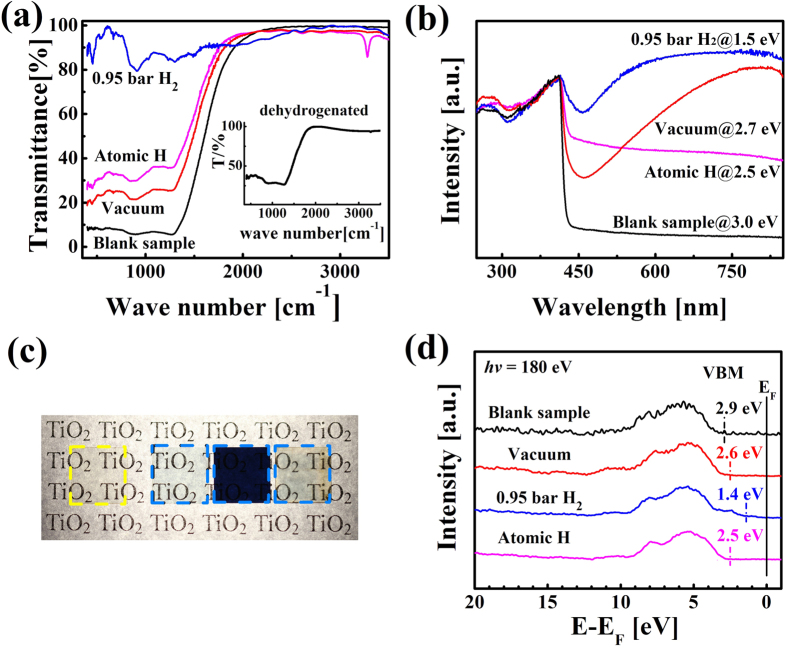
Figure 2. Characterizations of TiO2 single crystals.
(a) FTIR absorption spectra. The inset shows the FTIR spectrum of the atom-hydrogenated TiO2 after a 10 min-dehydrogenation at 700 ºC. (b) Optical absorption spectra. The band gap values are given. (c) Optical images of the blank, vacuum-annealed, gas-hydrogenated and atom-hydrogenated samples (from left to right). (d) Valence-band spectra of synchrotron radiation.

