Figure 6.

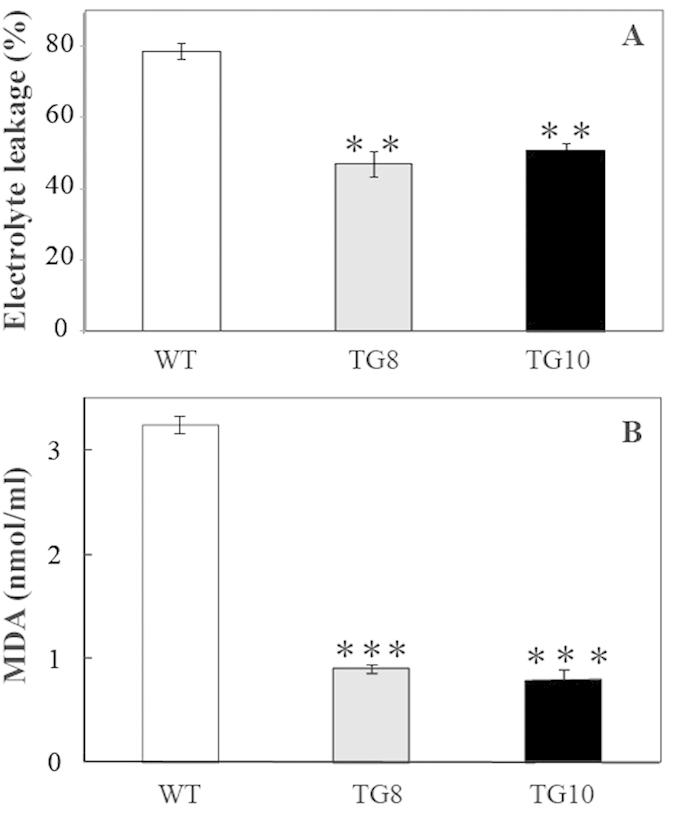
Measurement of MDA (A) and electrolyte leakage (B) in the overexpressing lines (TG8 and TG10) and the controls (WT) after chilling treatment for 3 d at 2 °C.

Measurement of MDA (A) and electrolyte leakage (B) in the overexpressing lines (TG8 and TG10) and the controls (WT) after chilling treatment for 3 d at 2 °C.