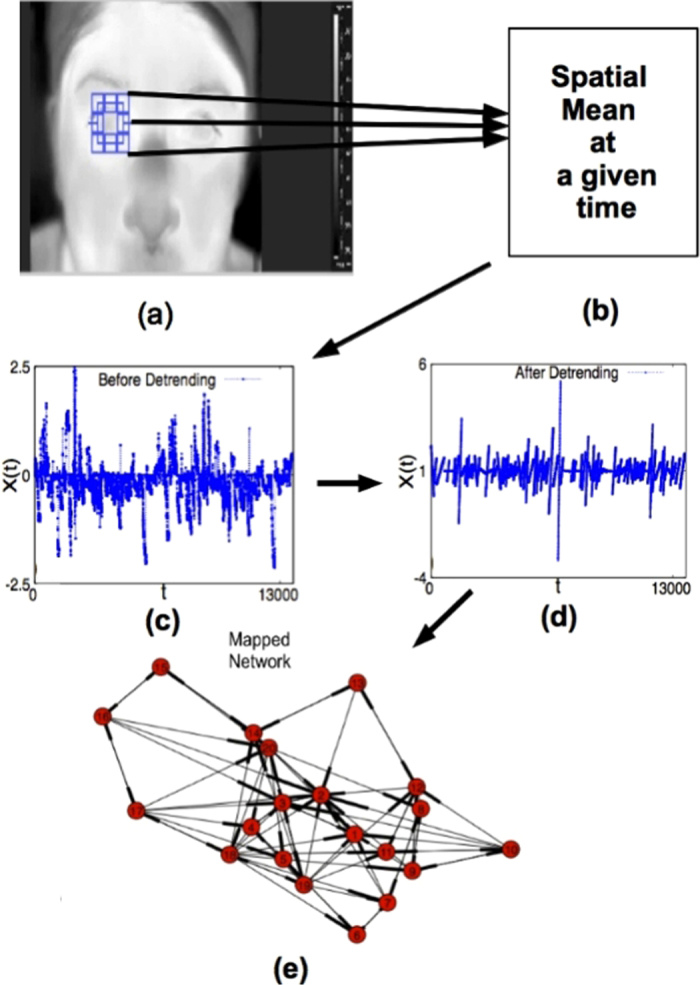
Figure 1. Outline of our method.

(a) Thermal imaging of the right eye of a arbitrary individual, (b) spatial mean of the cropped region of interest at time t. Plot of pooled thermal time series data for both eyes of a particular group (like dry eye patients or healthy individuals) of all such thermal images (c) before detrending, and, (d) after detrending. Directed network obtained from mapping of detrended time series is shown in (e).
