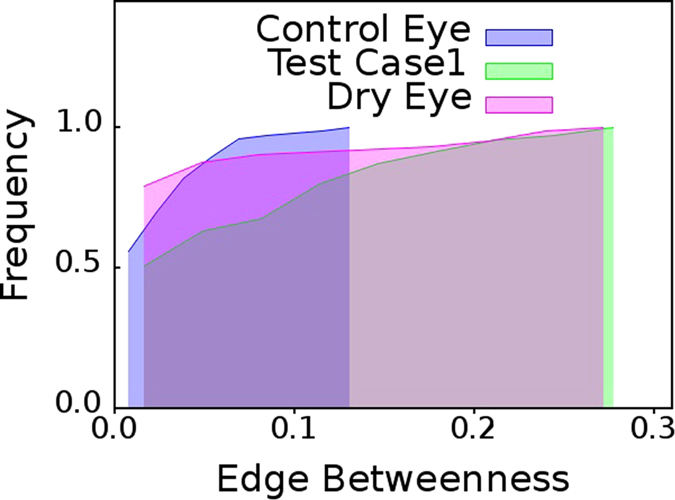
Figure 3. Test case: dry eye patient.

Cumulative distribution of edge betweenness centrality,  , for networks mapped from pooled thermal imaging time series for individuals with healthy eyes (control) and dry eye patients shown in Fig. 2 and a test case. The test case is that of a dry eye patient whose cumulative
  distribution is almost identical to the cumulative
  distribution of networks mapped from pooled thermal imaging time series data for all other dry eye patients.
