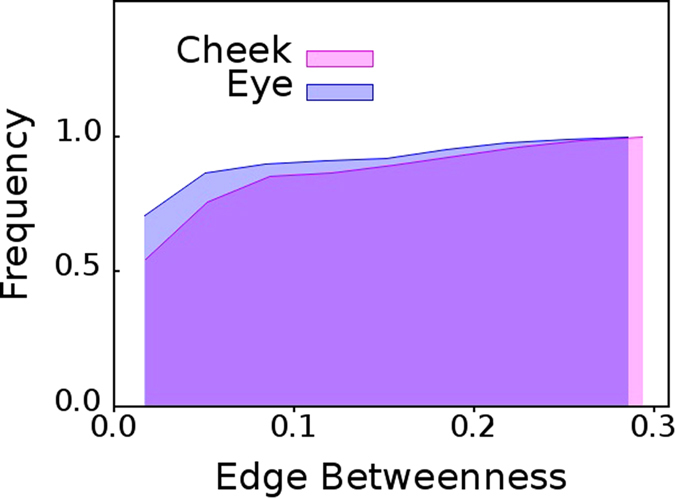
Figure 5. Cheek versus eyes of dry eye patients.

Cumulative distributions of edge betweenness centrality,  of networks mapped from pooled thermal imaging time series for 15 individuals with dry eyes, and, their cheeks.

Cumulative distributions of edge betweenness centrality,  of networks mapped from pooled thermal imaging time series for 15 individuals with dry eyes, and, their cheeks.