
Figure 6. Cheek versus eyes of healthy individuals.
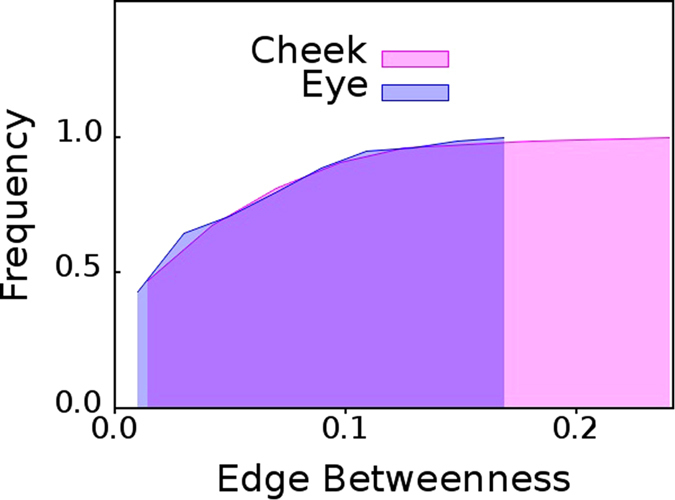
Cumulative distributions of edge betweenness centrality,  of networks mapped from pooled thermal imaging time series for 15 individuals with healthy eyes, and, their cheeks.
Official websites use .gov
A
.gov website belongs to an official
government organization in the United States.
Secure .gov websites use HTTPS
A lock (
) or https:// means you've safely
connected to the .gov website. Share sensitive
information only on official, secure websites.
Cumulative distributions of edge betweenness centrality, of networks mapped from pooled thermal imaging time series for 15 individuals with healthy eyes, and, their cheeks.