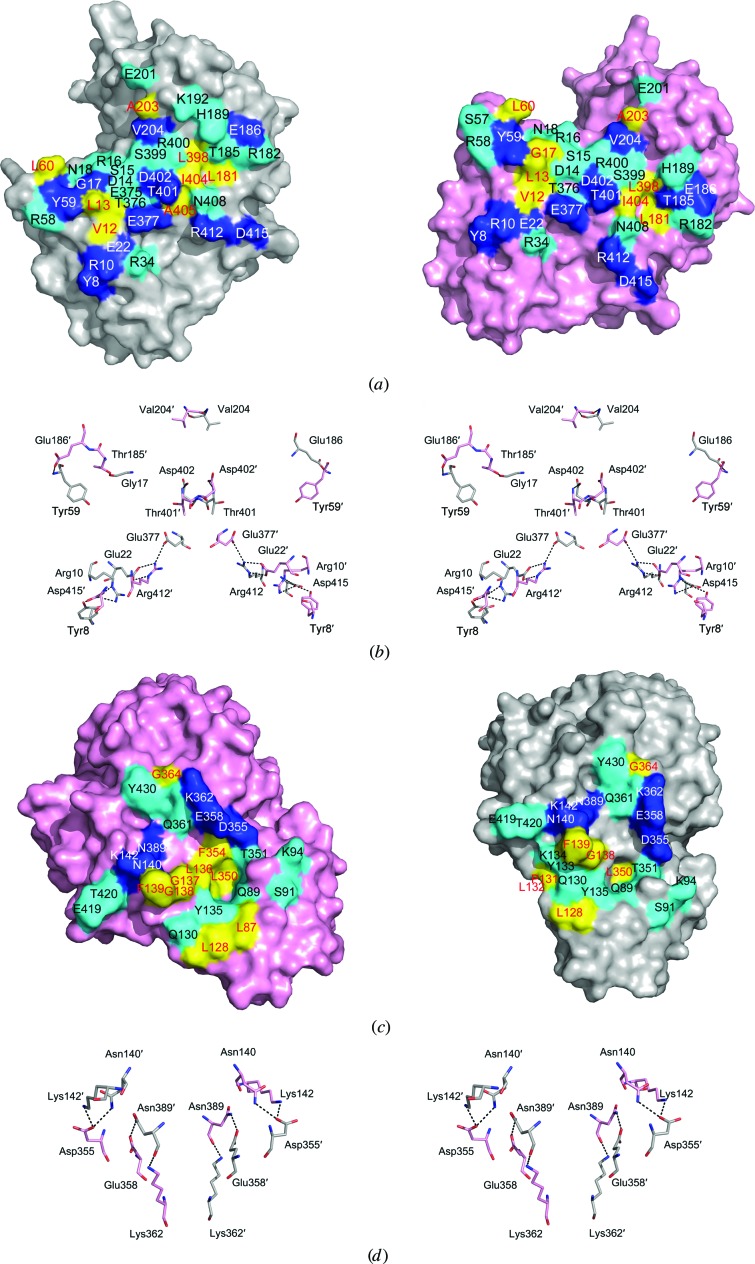
Figure 4.
Interface analysis of Sa_enolase. (a) The monomer–monomer interface surfaces are shown as an open-book presentation. (b) A stereoview of the hydrogen-bond network at the monomer–monomer interface. Residues from the neighbouring monomer are indicated with primes. (c) An open-book presentation of the dimer–dimer interface. (d) A stereoview of the hydrogen-bond network at the dimer–dimer interface. Hydrogen-bond, hydrophilic and hydrophobic interactions are coloured blue, cyan and yellow, respectively. Residues involved in hydrogen-bond, hydrophilic and hydrophobic interactions are labelled in white, black and red, respectively.

