Figure 3.
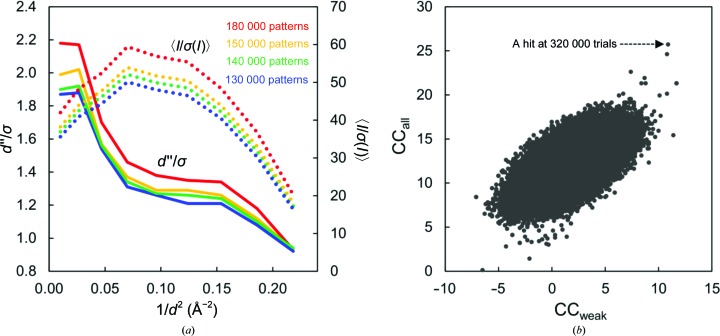
Results of SHELXC and SHELXD. (a) Statistics of the anomalous signal d′′/σ (solid line) and I/σ(I) (dotted line) produced by SHELXC. Four data sets of 180 000, 150 000, 140 000 and 130 000 patterns are coloured red, yellow, green and blue, respectively. (b) Correlation coefficient ratios (CCall/CCweak) from SHELXD using 150 000 patterns at 2.2 Å resolution.

