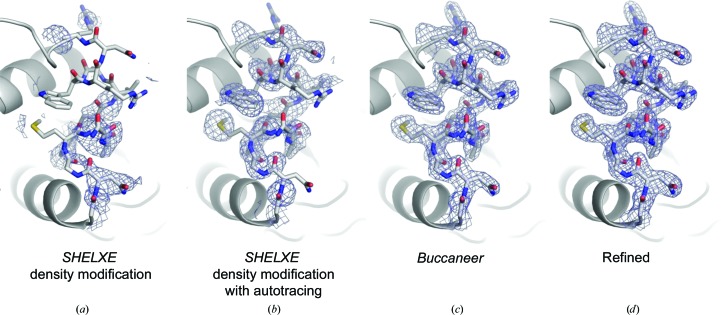
Figure 5.
2F o − F c electron-density maps contoured at the 1.0σ level from the various steps of the phasing process. SAD phasing was performed by (a) SHELXE with density modification, (b) SHELXE with density modification and autotracing and (c) Buccaneer with automatic model building; (d) shows the final refined map. These figures were drawn with PyMOL (http://www.pymol.org).

