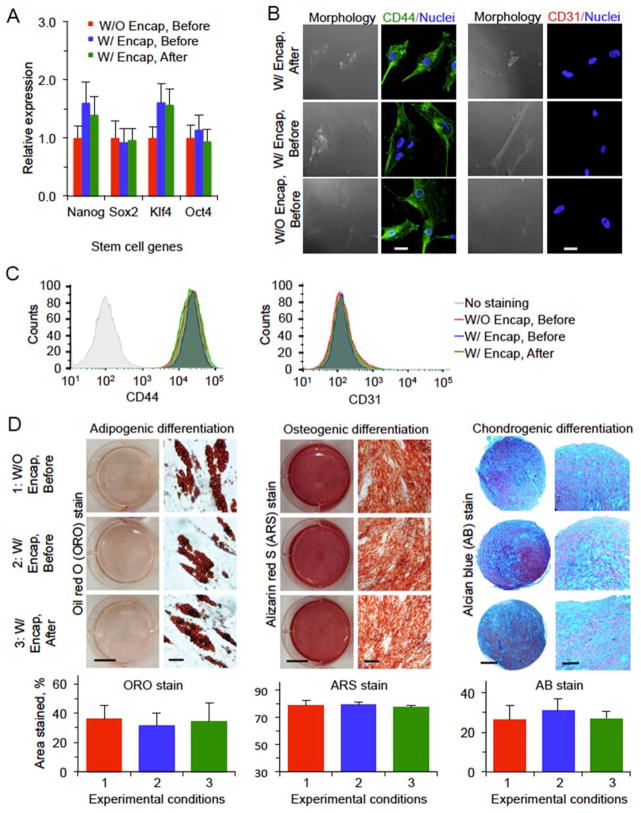
Figure 6.
Intact stemness and function of hADSCs after low-CPA vitrification in VSP with PS. (A) Relative expression of four stem cell genes determined by quantitative RT-PCR. (B) Immunostaining of CD44(+) and CD31(−) showing the expression of the two markers on the cells. (C) Quantification of CD44(+) and CD31(−) expression on the cells by flow cytometry. (D) Qualitative and quantitative data on adipogenic, osteogenic, and chondrogenic differentiations of hADSCs. Scale bars: 25 μm in (B), 10 mm (left) and 40 μm (right) for adipogenic differentiation in (D), 10 mm (left) and 200 μm (right) for ostegenic differentiation in (D), and 200 μm (left) and 100 μm (right) for chondrogenic differentiation in (D). No significant difference was observed between the hADSCs before and after vitrification either with (W/) or without (W/O) encapsulation (Encap).

