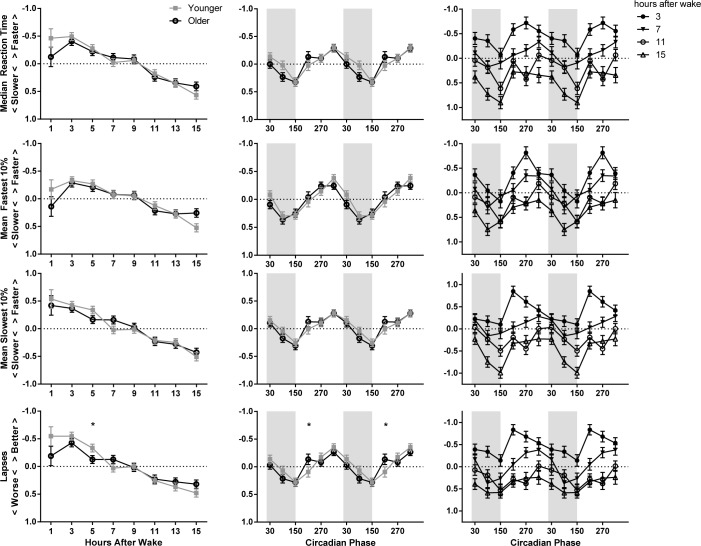
Figure 4.
Model-estimated z scores (± standard error) as a factor of homeostatic load (left), circadian phase (middle), and the interaction of homeostatic load and circadian phase (right) on PVT performance. The younger adolescent age group is indicated with gray filled squares and the older with black open circles. The circadian data are double plotted to better show circadian variation. Melatonin onset = 0°. Circadian bins are marked with the midpoint (i.e., 30° is DLMO-60°). Shaded areas indicate the approximate at-home baseline sleep schedule. The y axes have been reversed for median reaction time, the fastest 10% of reaction times, and lapses; higher indicates better PVT performance. The significant difference between age groups on PVT lapses are marked with asterisks. Post hoc comparisons were only performed on significant interaction terms.

