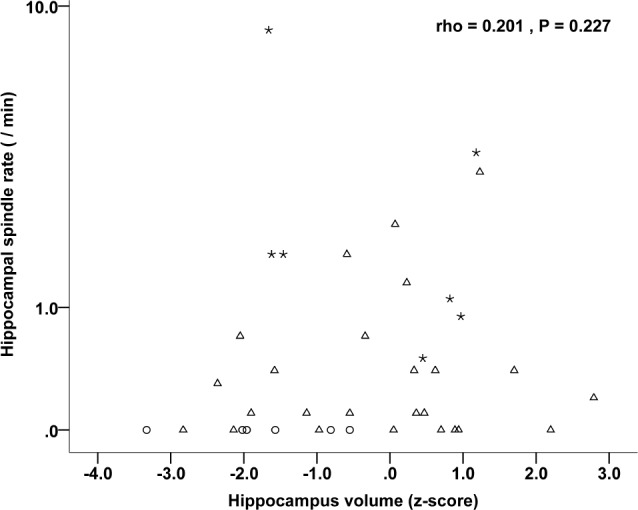
Figure 6.

Correlation between the individual hippocampus volumes and the hippocampal spindle rate. Stars represent hippocampi of patients with extraTLE (n = 7), triangles represent hippocampi of patients with TLE (n = 25), and circles represent hippocampi of multifocal patients (n = 6).
