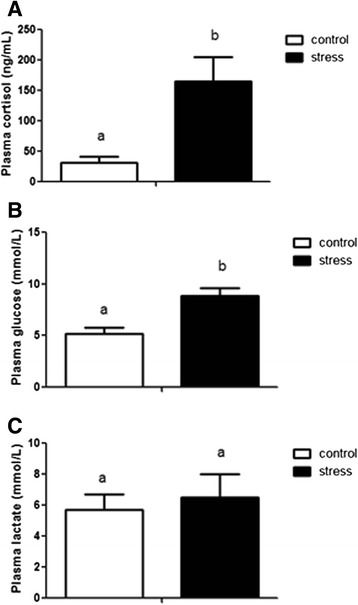
Fig. 1.

Plasma cortisol, glucose and lactate levels in control and handling stress groups. Data are represented as means ± SEM (n = 4). For all graphs, white and black bars represent control and stressed groups respectively. Different letters indicate significant differences among sampling points of each group
