
Fig. 3.
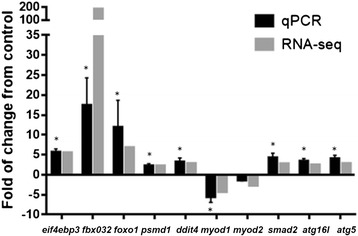
Quantitative real time PCR validation of ten DETs. The transcript expression fold changes measured by RNA-seq and qPCR are indicated by dark grey and light grey columns, respectively. Asterisks on the qPCR values indicate significant differences between control and stressed fish at p < 0.05 (n = 4)