
Fig. 3.
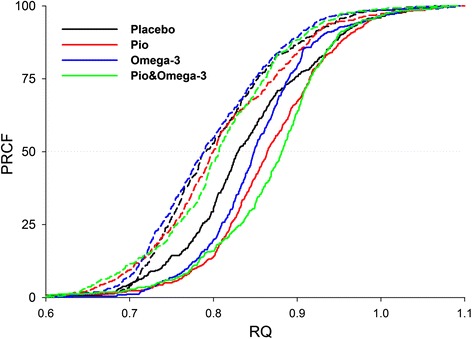
Metabolic flexibility after the interventions. RQ data from indirect calorimetry at week 24 (see Table 3) were used to construct PRCF curves, each of which represents data (~400) pooled from all patients in the given subgroup either in fasting state (dashed lines) or during clamp (solid lines). RQ values corresponding to EC50 (50th percentile value) on each of the curves were obtained and the difference between this RQ value assessed during the clamp and fasting, respectively, was used as a marker of metabolic flexibility to glucose (PRCF curve shift; Placebo, 0.04; Pio, 0.06; Omega-3, 0.06; Pio& Omega-3, 0.07)