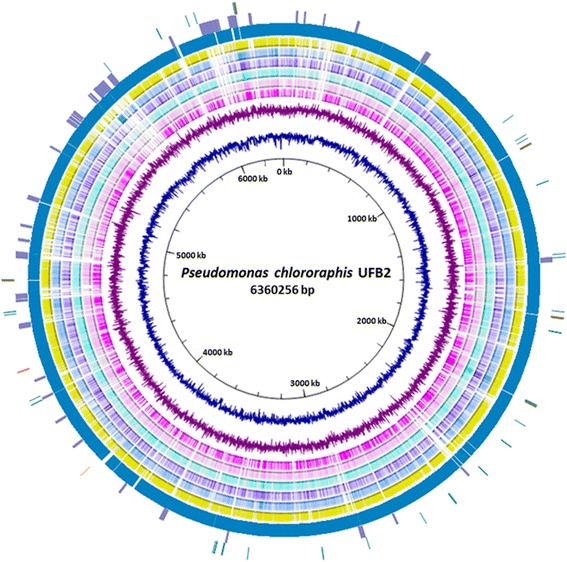
Fig. 3.

Circular representation of the P. chlororaphis UFB2 genome compared with six sequenced Pseudomonas whole genomes. Rings from inside to outside: (1) Scale, (2) GC content (navy), (3) GC skew (purple), (4) BLAST comparison with P. syringae pv. syringae B728a (deep pink), (5) BLAST comparison with P. putida KT2440 (pink), (6) BLAST comparison with P. chlororaphis strain PA23 (cyan), (7) BLAST comparison with P. aeruginosa PAO1 (violet), (8) BLAST comparison with P. fluorescens Pf0-1 (skyblue), (9) BLAST comparison with P. sp. UW4 (yellow), (10) Coding sequences of P. chlororaphis UFB2 genome (dark cyan), (11) Gene islands (medium purple), (12) rRNA genes (orange), tRNA genes (dark green) and ncRNA (red). BLASTn comparison of genomes was visualized by BRIG [53] and UFB2 genome the image was generated with Circos [54]
