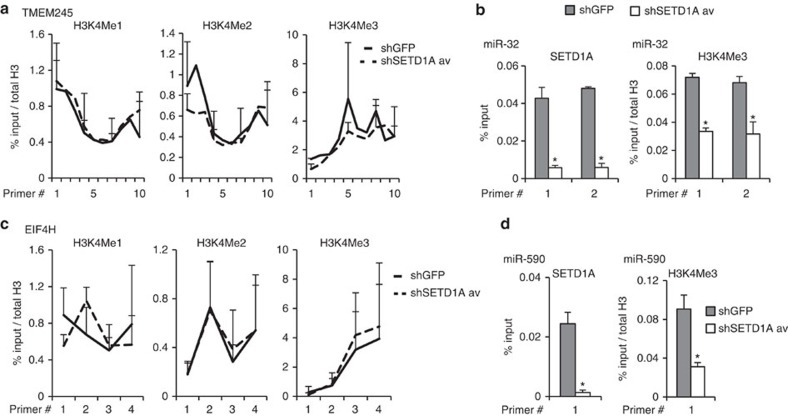
Figure 3. SETD1A regulates the promoters of miR-32 and miR-590-5p.
(a) H3K4Me1, H3K4Me2 and H3K4Me3 marks on the promoter region of TMEM245 were analysed using 10 primers that span the region. The results show that SETD1A does not regulate these chromatin marks on the TMEM245 promoter. (b) SETD1A binding and H3K4Me3 on the putative promoter region of miR-32 were analysed using two primers that span the region. The results show that SETD1A depletion suppresses H3K4 methylation and SETD1A binding to this domain. (c) H3K4Me1, H3K4Me2 and H3K4Me3 on the promoter region of EIF4H were analysed using four primers that span the region. The results show that SETD1A does not regulate these chromatin marks on the EIF4H promoter. (d) SETD1A binding and H3K4Me3 marks on the putative promoter region of miR-590 was analysed using a single primer that spans the region. The results show that SETD1A depletion suppresses H3K4 methylation and SETD1A binding to this domain. For all experiments, shSETD1A data points represent the average derived from ChIP assays performed with cells individually infected with two different shSETD1A constructs. Data are represented as mean±s.d. of the average of three experimental replicates. Asterisks indicate P values of P<0.05 for relevant figures by Student's t-test.

