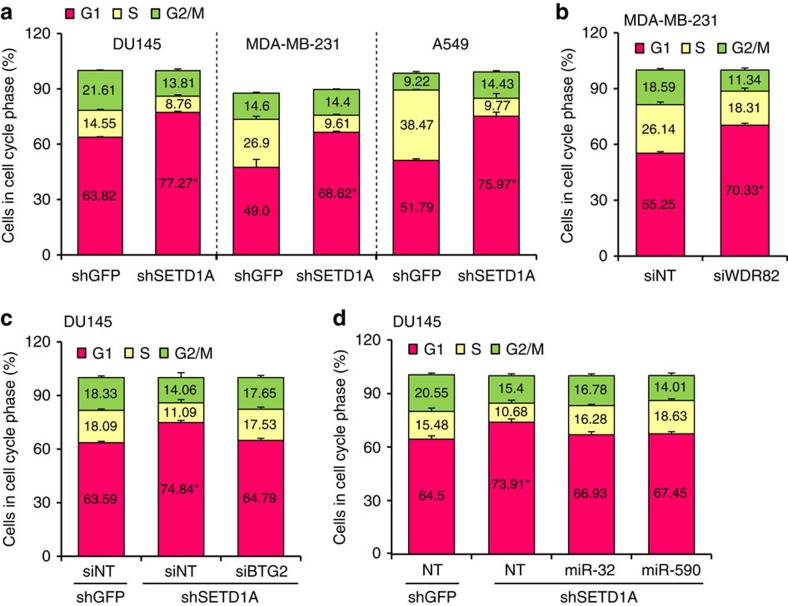
Figure 5. SETD1A regulates cell cycle progression.
(a) SETD1A depletion increases the G1 fraction. Cell cycle analysis of MDA-MB-231, A549 and DU145 cells infected with shGFP and shSETD1A constructs. The per cent cell cycle distribution of SETD1A-depleted cells represents the average derived from cells individually infected with the two different shSETD1A constructs. (b) WDR82 depletion increases the G1 fraction. Cell cycle analysis of MDA-MB-231 cells transfected with siWDR82 and siNT sequences. The per cent cell cycle distribution of WDR82-depleted cells represents the average derived from cells individually transfected with the two different siWDR82 constructs. (c) Depletion of BTG2 partially reverses the increase in the G1 fraction exhibited by SETD1A knockdown cells. Cell cycle analysis of shSETD1A-infected cells transfected with siBTG2 and NT siRNA (siNT). shGFP-infected cells transfected with siNT are shown as control. As previously seen, knockdown of SETD1A (siNT) increases the fraction of cells in G1 compared with shGFP (siNT)-infected cells. Suppression of BTG2 with siBTG2 in shSETD1A cells reverses this effect. (d) miRNAs reverse the G1 increase in SETD1A-depleted cells. Cell cycle analysis of shSETD1A-infected cells transfected with miRNA-32 and -590 mimics. Knockdown of SETD1A (siNT) increases the fraction of cells in G1 compared with shGFP (siNT)-infected cells. The mimics against miRNA-32 and -590 partially suppress this effect. Data are represented as mean±s.d. of the average of three experimental replicates. Asterisks indicate P values of P<0.001 for a,b and P<0.005 for c,d by Student's t-test.

