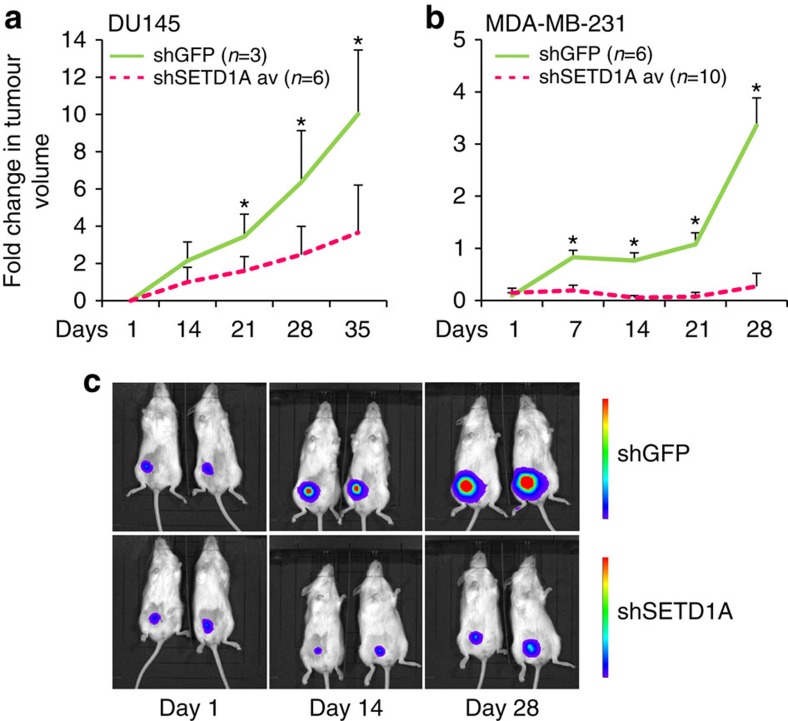
Figure 6. SETD1A regulates tumorigenesis.
(a) DU145 cells infected with shGFP- and shSETD1A lentiviruses were inoculated subcutaneously into immunocompromised mice. Fold change in tumour volume and the number of animals in each group are shown. The volume of SETD1A-depleted tumours represents the average derived from cells individually infected with the two different shSETD1A constructs. Data are represented as mean±s.d. of the average of each group. Asterisks indicate P values of P<0.05 by Student's t-test. (b) Luciferase expressing MDA-MB-231 cells infected with shGFP- and shSETD1A lentiviruses were inoculated into the mammary fat pad of immunocompromised mice. Tumour growth was monitored by bioluminescence imaging. The fluorescence intensity of SETD1A-depleted tumours represents the average derived from tumour cells individually infected with the two different shSETD1A constructs. The number of animals in each group are shown. Data are represented as mean±s.d. of the average of each group. Asterisks indicate P values of P<0.05 by Student's t-test. (c) Serial bioluminescence imaging of shGFP and shSETD1A-MDA-MB-231 tumour-bearing mice from experiment described above (Fig. 6b) is shown.

