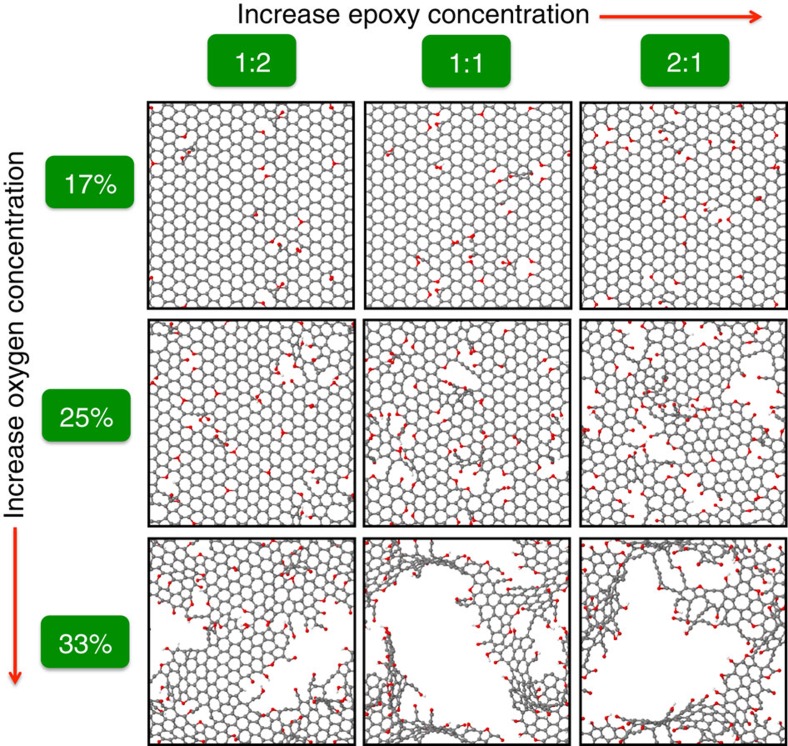
Figure 2. Relationship between defect sizes and synthesis parameters.
Representative rGO structures in our simulations obtained from different synthesis conditions are shown in a 3 by 3 matrix. The epoxy/hydroxyl ratio and initial oxygen concentration of GO sheets vary along the horizontal and vertical direction, respectively. The reduction temperature for the formation of these structures was set to 2,500 K. All structures are represented as ball and stick with carbon, oxygen and hydrogen atoms in grey, red and white colour, respectively.

