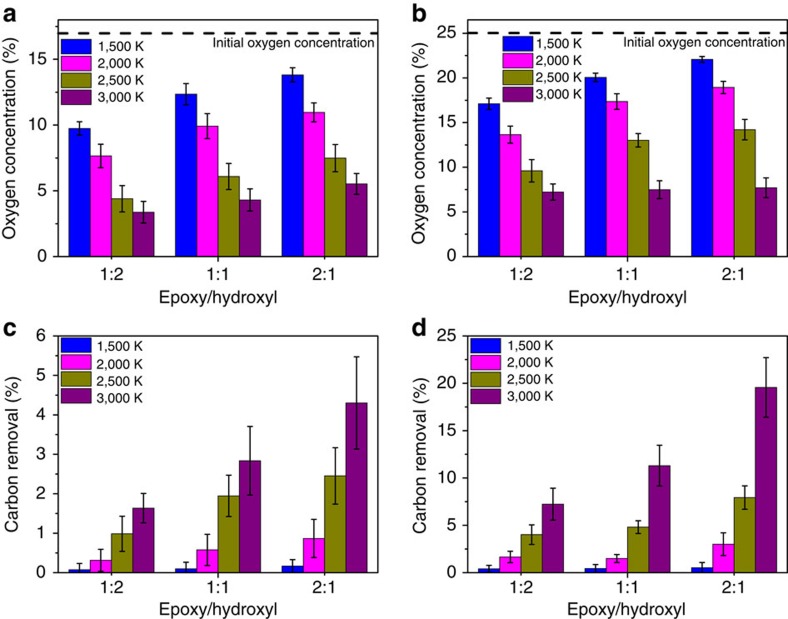
Figure 3. Extent of reduction and carbon removal.
The statistically averaged oxygen concentration of resulting rGO materials (a,b) and the corresponding percentage of carbon removal (c,d) were calculated over ten different samples for each combination of synthesis parameters. Figures a, c and b, d represent the result of initial GO oxygen concentration of 17% and 25%, respectively. The initial oxygen concentration is highlighted using a dashed black line in a,b. The result of 33% initial oxygen concentration can be seen in Supplementary Fig. 1.

