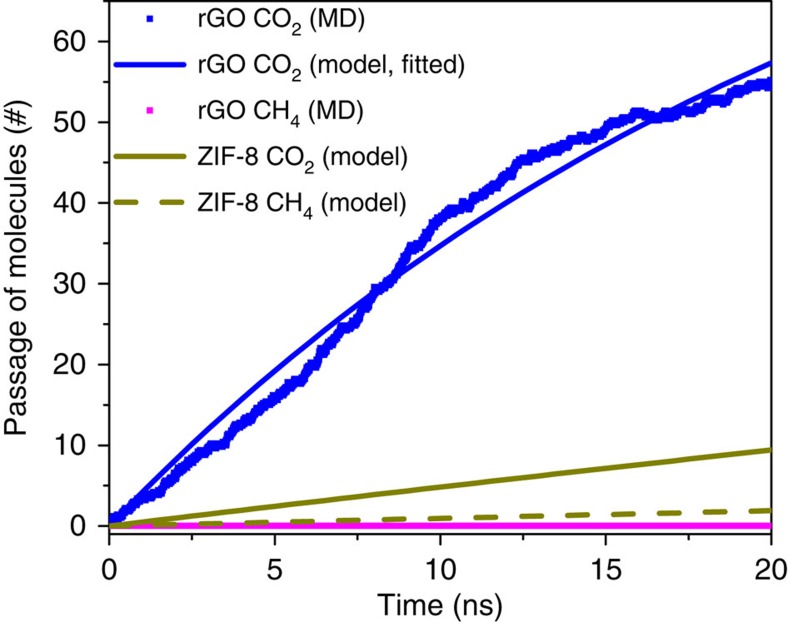
Figure 4. Comparison between rGO membrane and ZIF-8 membrane for CO2/CH4 separation.
Molecular simulations were carried out to estimate the number of gas molecules passing through the rGO membrane as a function of simulation time averaged over five independent simulations (CO2 and CH4 are represented as blue and magenta squares, respectively). The CO2 result obtained from MD simulations was further fitted using the membrane process model (see Methods section), and the CO2 permeance of the rGO membrane was determined to be 2.1 × 10⁻⁴ (mol m−2 s−1 Pa−1; solid blue line). As a comparison, the corresponding CO2 (solid dark yellow line) and CH4 (dashed dark yellow line) results using ZIF-8 membranes are also provided, which were estimated using the membrane process model (see Methods section) with experimentally reported parameters23.

