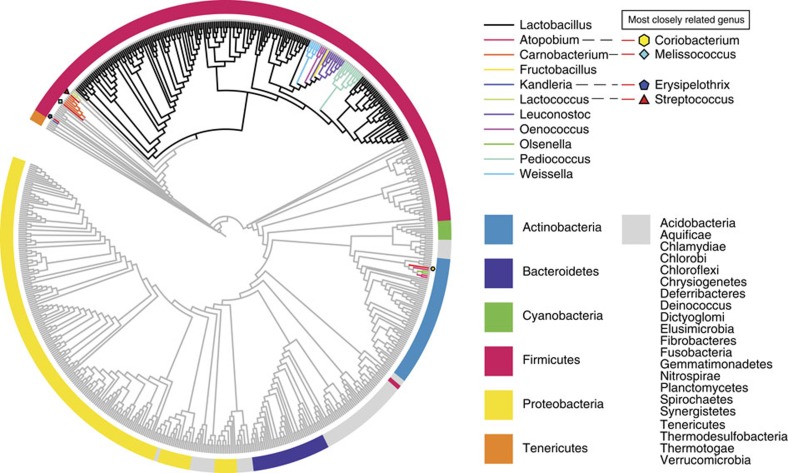
Figure 1. Cladogram of 452 genera.
Cladogram of 452 genera from 26 phyla with the 213 genomes analysed in this study, based on the amino-acid sequences of 16 marker genes. The tree was built using the maximum likelihood method but visualized by removing the branch length information. The coloured branches indicate different genera sequenced in this research; grey branches indicate members of genera whose genomes were previously sequenced. The colours in the outer circle represent the phyla that are indicated in the legend, and the different shapes near branch-tips indicate the position of genera that are most closely related to Atopobium, Carnobacterium, Kandleria and Lactococcus, separately.

