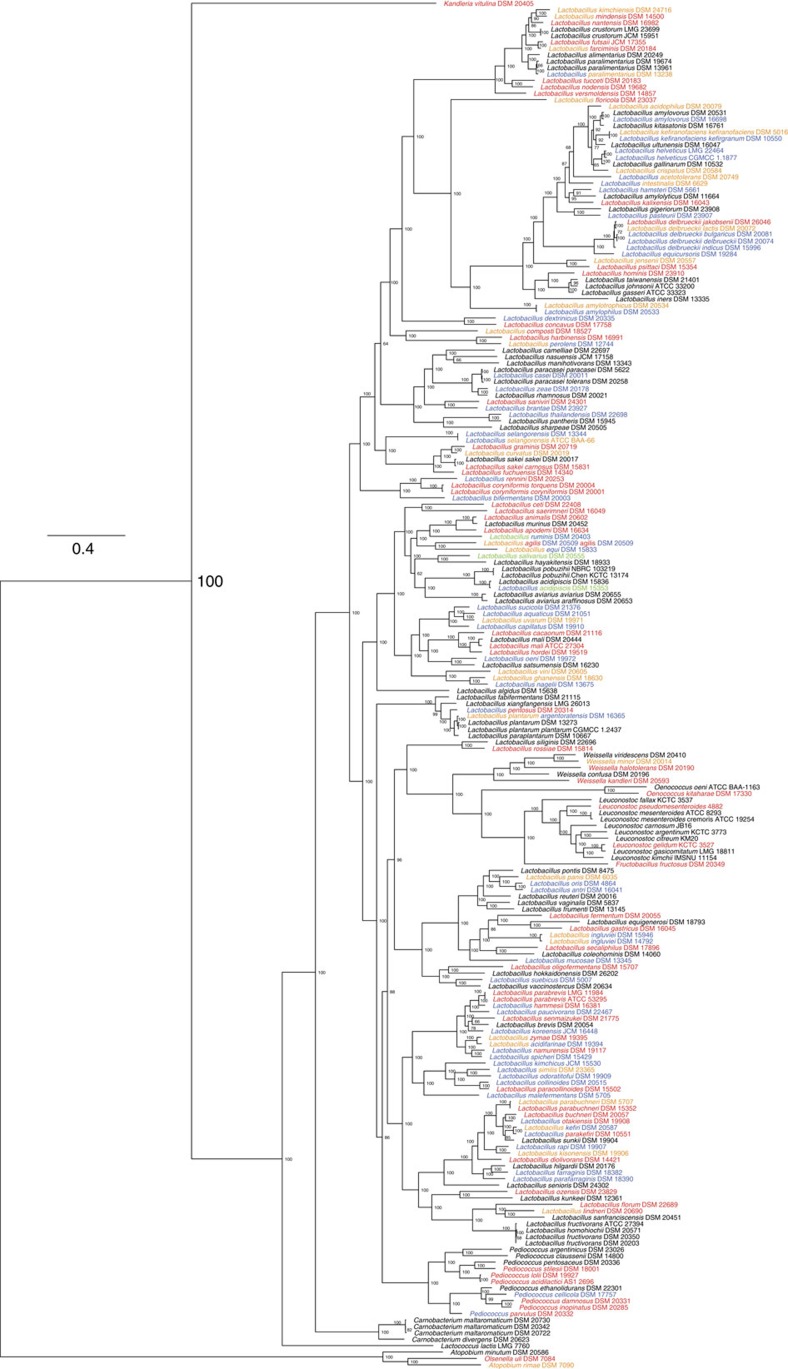
Figure 2. Maximum likelihood phylogeny derived from 73 core genes across 213 strains.
The phylogeny was estimated using the PROTCATWAG model in RAxML and rooted using the branch leading to Atopobium minutum DSM 20586, Olsenella uli DSM 7084 and Atopobium rimae DSM 7090 as the outgroup. Bootstrapping was carried out using 100 replicates and values are indicated on the nodes. Colours on taxon labels indicated the presence of CRISPR-Cas systems using blue, red and green for Type I, II and III systems, respectively. Undefined systems are represented in orange. Colour combinations were used when multiple systems from different families were concurrently detected in bacterial genomes.

