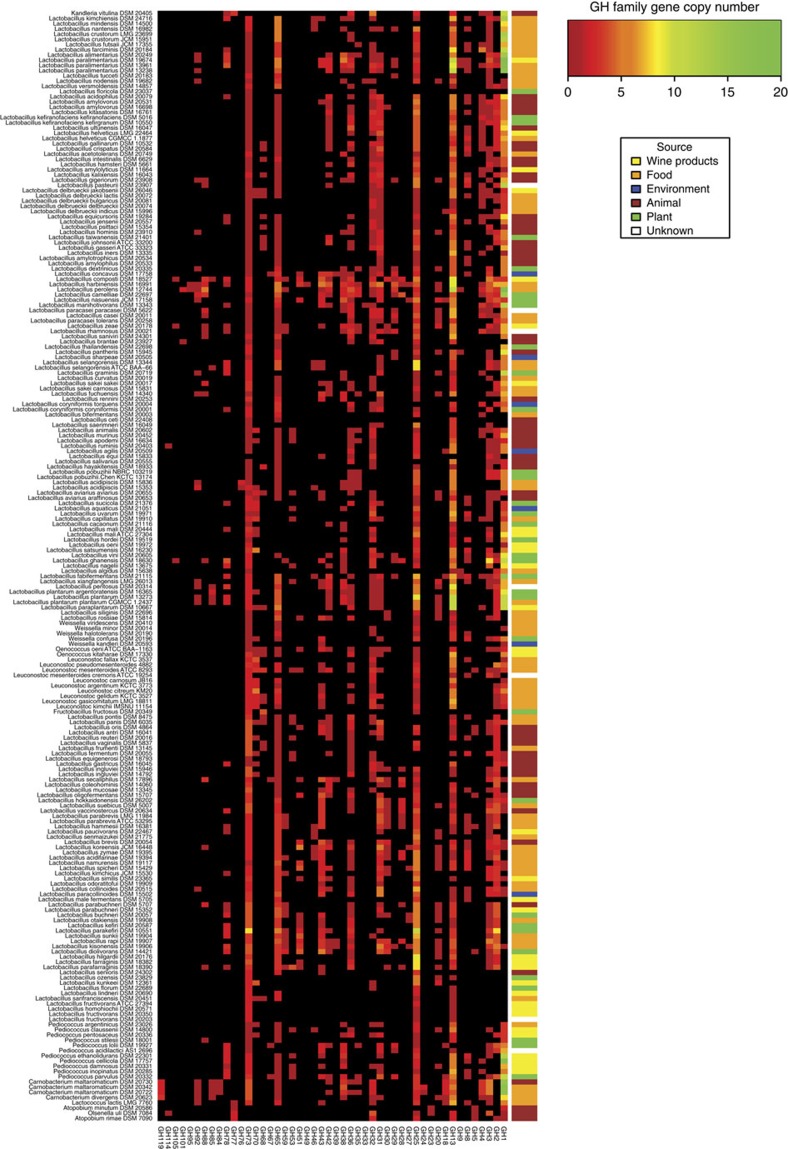
Figure 3. Heat map illustrating the distribution and abundance of glycoside hydrolase (GH) family genes across the Lactobacillus Genus Complex and associated genera.
Gene copy number of each of the 48 represented GH families is indicated by the colour key ranging from black (absent) to green. Strains are graphed in the same order left to right as they appear top to bottom in the phylogeny (Fig. 2) with the isolation source of each strain indicated by the colour bar at the top of the heat map.

