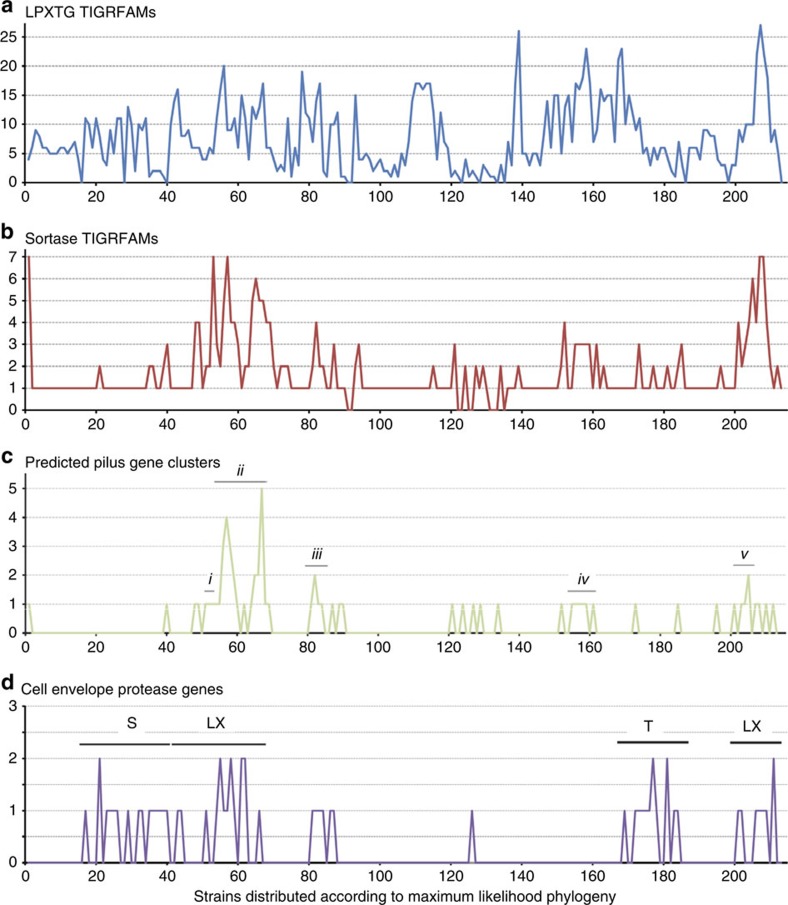
Figure 4. Differential abundance of genes encoding LPXTG proteins, sortases, pili and cell envelope proteases (a–d, respectively).
The y axis indicates the number of genes/clusters detected. Strains are graphed in the same order left to right as they appear top to bottom in the phylogeny (Fig. 2). In c, each black bar indicates strains belonging to the same lineages. (c) Labels: i, the L. composti clade; ii, the L. casei/rhamnosus clade; iii, the L. ruminis clade; iv, the L. brevis/parabrevis clade; v, the Pediococcus ethanolidurans clade. (d) Labels: LX, LPXTG-sortase-dependent anchor (including derivatives); S, S-layer type anchor; T, truncated protein.

