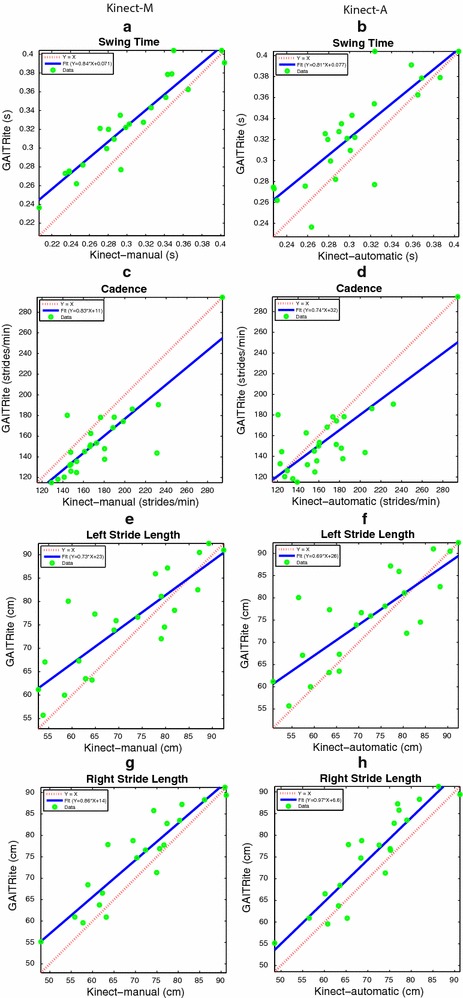
Fig. 15.

Scatter plots. On the left side: a, c, e, g show the comparison between GAITRite (criterion) and Kinect-M, where gait parameters are estimated with heel strike and toe-off instants computed manually. On the right side: b, d, f, h show the comparison between GAITRite (criterion) and Kinect-A, where gait parameters are computed fully automatically. Solid lines indicate the linear best-fit. Dashed lines indicate the identity line. The parameters compared are swing time, cadence, left stride length, and right stride length
