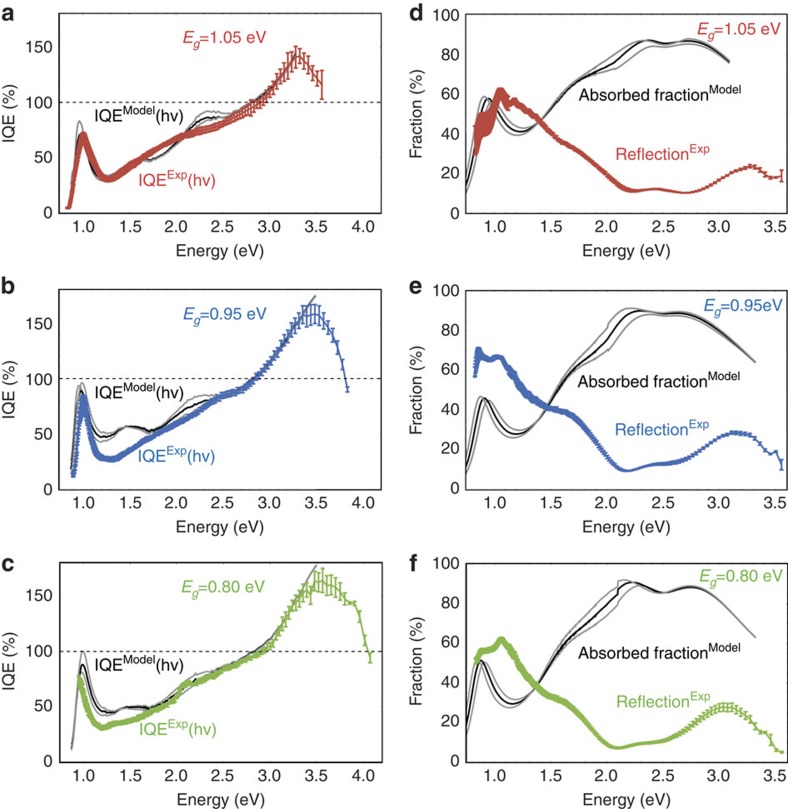
Figure 4. Internal quantum efficiency (IQE) of photovoltaic devices.
NRs with bandgaps of 1.05 eV (a), 0.95 eV (b) and 0.80 eV (c). IQEEXP(hv) and IQEModel(hv) were determined, respectively, using reflectance measurements and optical modelling as described in the text. (d–f) The measured reflection (coloured curve) and modelled absorbed fraction for bandgaps of 1.05, 0.95 and 0.80 eV, respectively. Error bars show the standard deviation of multiple independent solar cells (six cells for 1.05 eV, five cells for 0.95 eV and five cells for 0.80 eV). The range of grey curves shown for the modelled results illustrate the effect of changing the active layer thickness in the model by the experimental error of ±10 nm.

