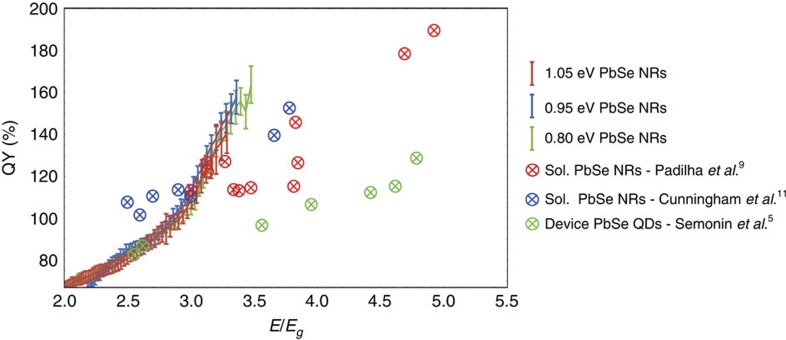
Figure 5. Comparison IQEs with literature.
IQEs of devices consisting of PbSe NRs with bandgaps of 1.05, 0.95 and 0.80 eV and MEG quantum yields of, PbSe QDs in devices5 and PbSe NRs in solution9,11. Error bars show the standard deviation of multiple independent solar cells (six cells for 1.05 eV, five cells for 0.95 eV and five cells for 0.80 eV). A comparison including MEG quantum yields of PbSe QDs in solution34,36 and PbSe QDs in films35 can be found in Supplementary Figure 11.

