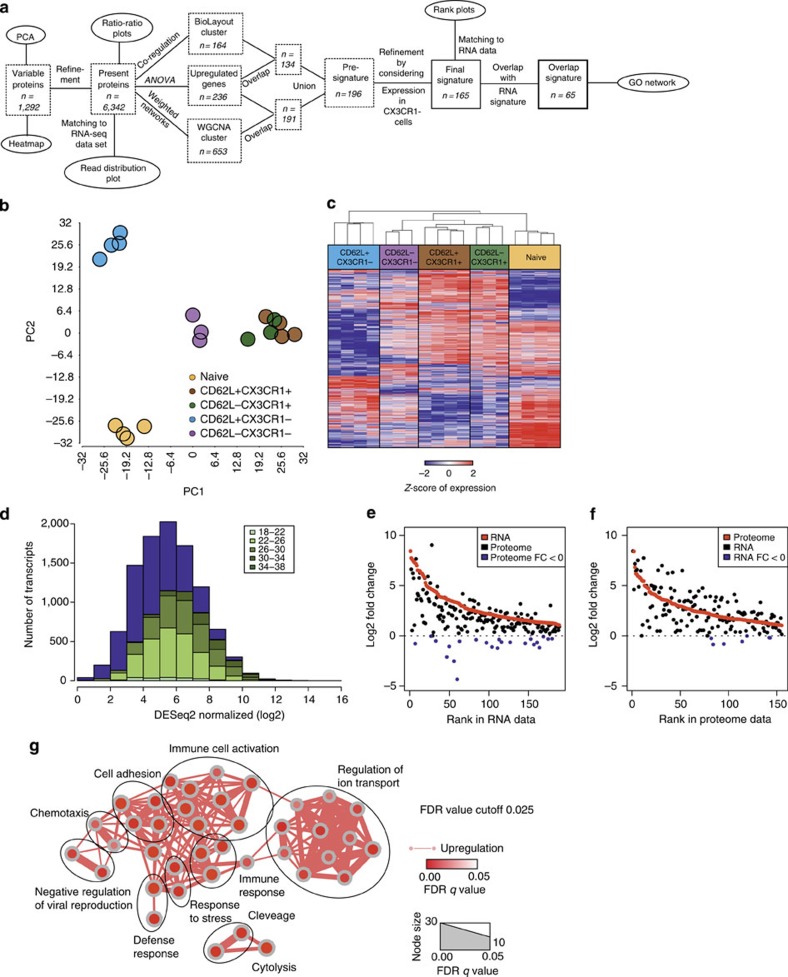
Figure 5. Proteome signature of human CX3CR1+ memory CD8+ T cells with effector function.
(a) Scheme describing the workflow for analysis of proteome data. (b) Principal component analysis (PCA) based on present and variable proteins. (c) Heat map showing the z-transformed expression values of present and variable proteins, coloured from blue to red. (d) Histogram of normalized RNA-seq expression values of present genes subdivided according to the corresponding log2-transformed protein expression. Violet bars illustrate expression values and amounts of all present transcripts, whereas green-shaded bars represent expression values and amounts of transcripts matched to proteins. (e) Fold change rank plot of RNA-seq signature genes (red) with overlay of ranks of the corresponding proteins (black). Proteins having a log2-fold change lower than 0 are marked in blue. (f) Fold change rank plot of protein signature genes (red) with overlay of ranks of the corresponding RNA-seq genes (black). Genes having a log2-fold change lower than 0 are marked in blue. (g) Network visualization of Gene Ontology Enrichment Analysis using BiNGO and EnrichmentMap based on the 65 genes overlapping between the transcriptome and proteome signatures. Enriched GO terms are depicted by red nodes, where colour and size represent the corresponding FDR-adjusted enrichment P-value (q-value)<0.025.

