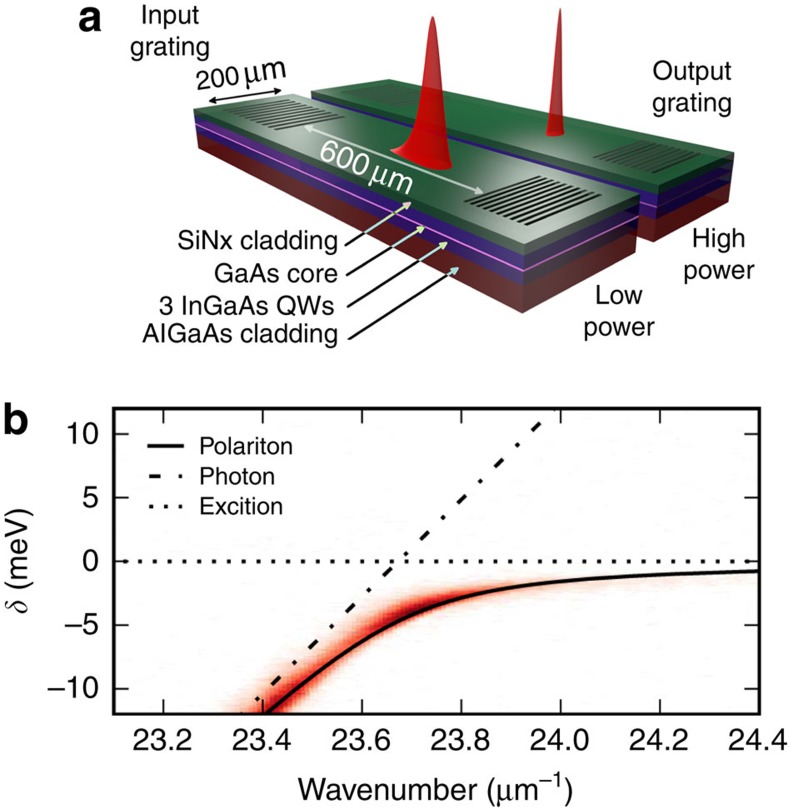
Figure 1. Exciton polaritons in waveguides.
(a) Schematic diagram of waveguide (the same waveguide is shown with pulses under low-power and high-power excitation conditions). (b) Angle-resolved photoluminescence spectrum showing emission from the lower polariton branch in red. The fitted polariton dispersion (solid line) is shown with the uncoupled exciton and photon modes, which would exist for zero light–matter coupling (dotted and dashed lines). The horizontal and vertical axes are respectively the wavenumber of the guided mode and the detuning δ between polariton and exciton energies.

