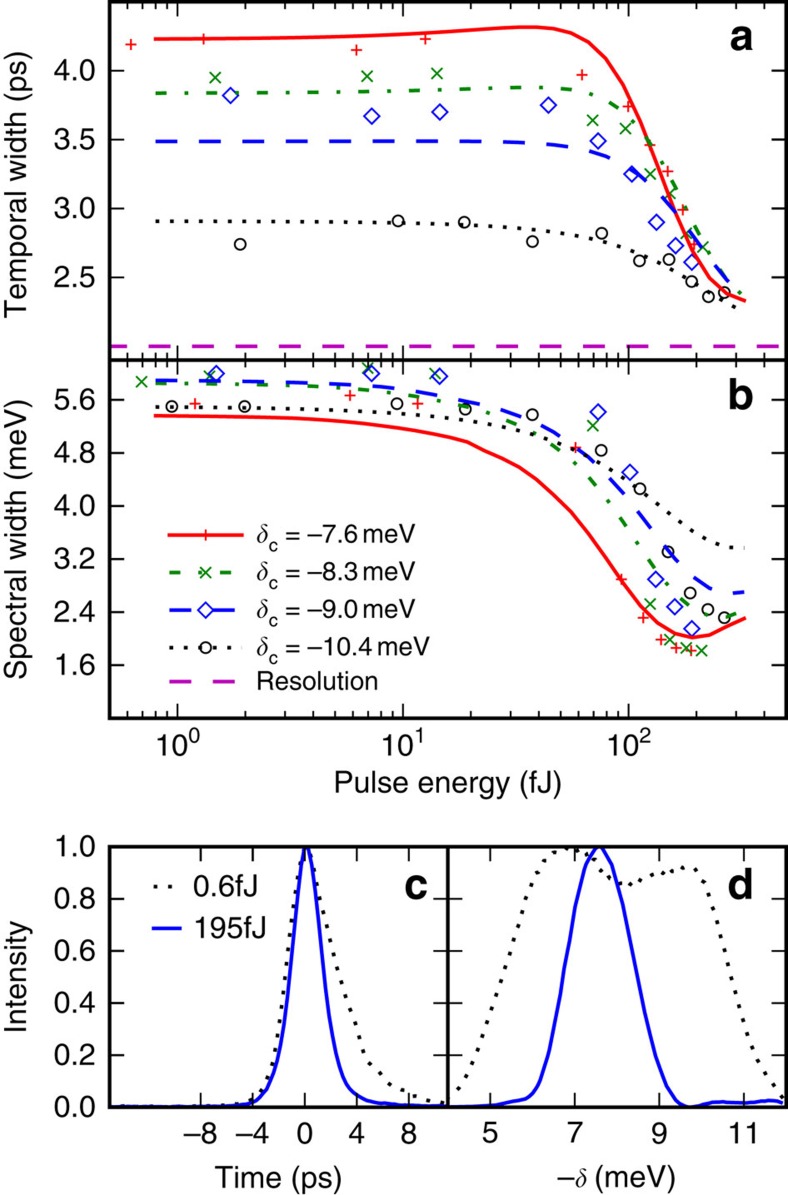
Figure 2. Comparison of experimentally measured and numerically simulated temporal and spectral pulse FWHMs at the output grating.
(a) Experimental (symbols) and numerically simulated (line) pulse temporal duration versus pulse energy inside the waveguide for a number of detunings δc of the central pulse frequency from the exciton. (b) Experimental (symbols) and numerically simulated (lines) pulse spectral width versus pulse energy for the same detunings. (c) Temporal profiles at high and low pulse energy. (d) Spectral profiles at high and low pulse energy. Uncertainties of 1% in the experimental points are due to reading the FWHM from the noisy curves. Numerical simulations are for similar excitation conditions as in the experiment. The semi-quantitative agreement indicates that solitons are observed in the experiment.

