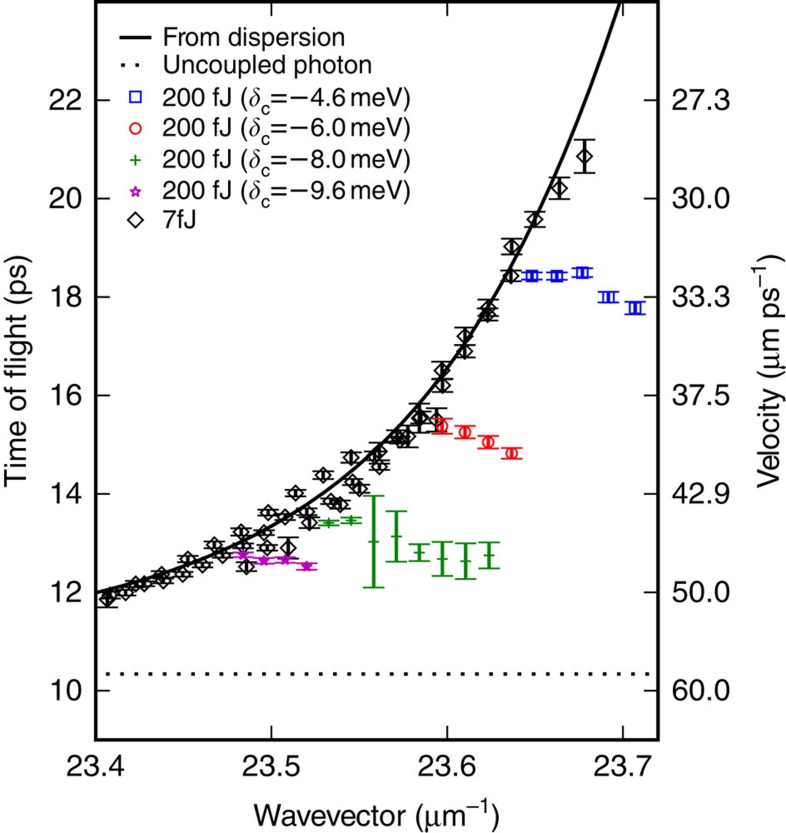
Figure 3. Measured time of flight of different wavevector components of pulse at low power (black diamonds) and high power (coloured symbols), and time of flight extracted from curvature of polariton dispersion (solid curve).
The error bars give the 95% confidence interval for the time of flight and were calculated from the uncertainties in positions determined by fitting the incident and transmitted pulses (see Methods).

