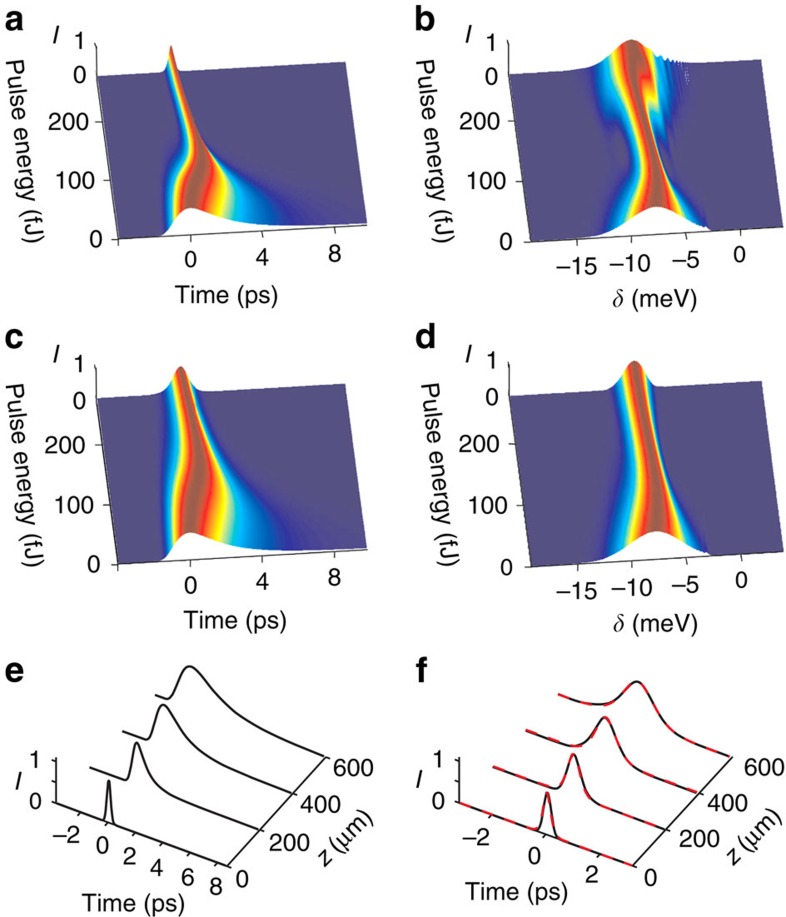
Figure 4. Numerically computed pulse propagation.
Time and frequency domain pulse profiles at the end of the waveguide for the lossless (a,b) and lossy (c,d) cases. Evolution of the pulse along the length of the waveguide incuding loss for pulse energies below (e) and above (f) the soliton formation threshold, respectively. In f, the dashed red curves are analytic soliton solutions.

