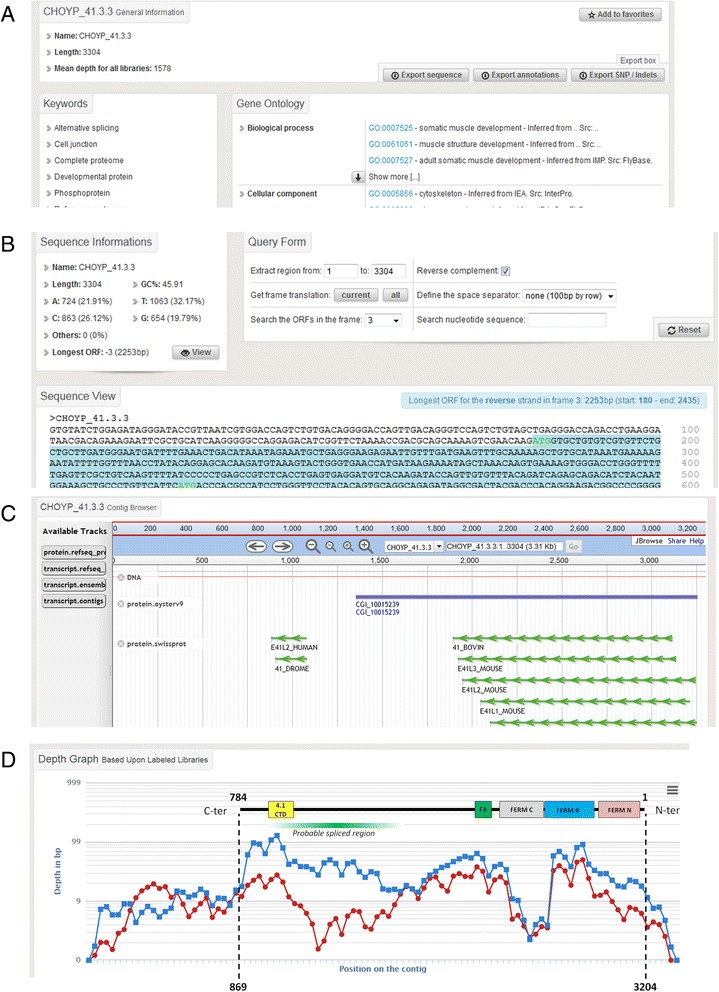
Fig. 4.

An overview of a contig search results. a: Caption from the ‘General Info’ tab. This screen enables the user to display and retrieve general information about the searched contig, including related keywords and functional annotation such as Gene Ontology. b: Caption from the ‘Sequence View’ tab. Statistics and DNA sequence of the contig are presented on this this screen. An embedded tool enables the user to search ORFs and get their translation. c: Caption from the ‘JBrowse View’ tab. This browser enables a quick overview of the contig and its corresponding counterparts in other databases. d: Caption from the ‘Depth View’ tab that contains expression data as the mean coverage and number of reads of the contig in all the libraries that can be chosen and displayed on a graph using a point-and-click interface. As an example, the contig CHOYP_41.3.3 is displayed in the Amu (in red) and Dgl (in blue) libraries. The structure of the corresponding protein has been added to the graph with the domain architecture. Discrepancies in mean depth coverage between library assembly variants may indicate splice variants at these positions (green gradient frame)
