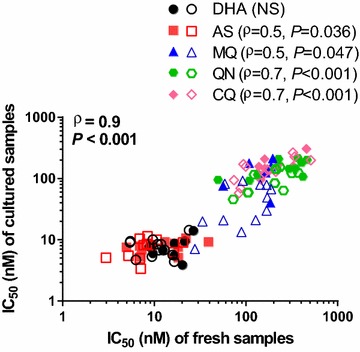
Fig. 2.

Correlations between IC50 values attained from paired fresh and culture adapted samples for 12 Plasmodium falciparum isolates using the combined values for both the HRP-2 and SYBR Green I assays. IC50 for each drug are presented in different colours, with unfilled and filled symbols representing HRP-2 and SYBR Green I IC50, respectively. Spearman ρ and P values from combined HRP-2 and SYBR Green I results are shown for each drug, with an overall Spearman’s correlation coefficient of 0.9 (P < 0.001)
