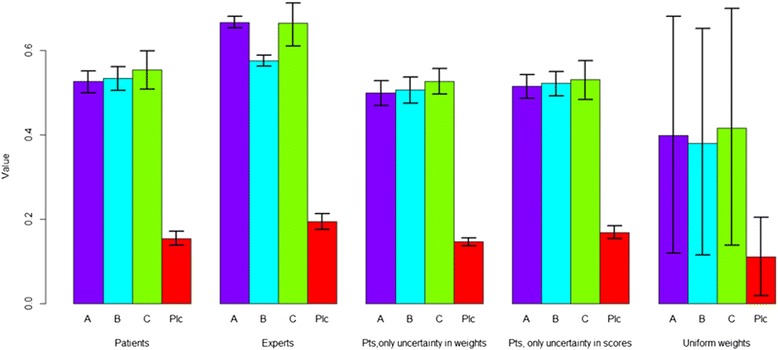
Fig. 3.

Overview of the overall values of the included treatments. From left to right: patients (with uncertainty in weights and performance scores), experts (with uncertainty in performance scores), patients (with uncertainty in weights but no uncertainty in performance scores), patients (with uncertainty in performance scores but no uncertainty in weights), uniformly distributed weights (with uncertainty in performance). The error bars indicate the 95 % confidence intervals. Pts = Patients, Plc = Placebo
