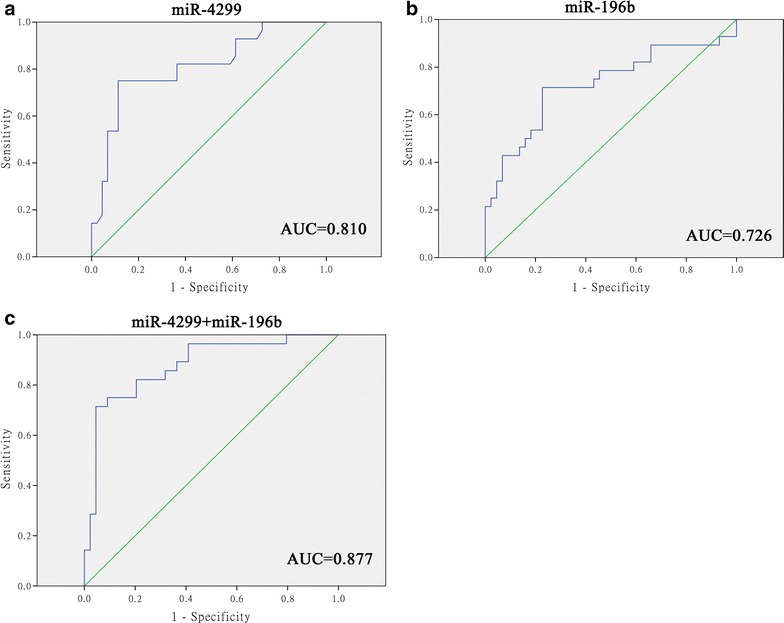
Fig. 3.

Receiver operating characteristics (ROC) curve analysis using miR-4299 and miR-196b for discriminating chemoresistance of colon tumors. miR-4299 yielded an AUC (the areas under the ROC curve) of 0.810 (95 % CI 0.704–0.917) with 75.0 % sensitivity and 88.6 % specificity in discriminating non-responder (a), and miR-196b yielded AUC of 0.726 for miR-196b (95 % CI 0.597–0.856) with 71.4 % sensitivity and 77.3 % specificity in discriminating non-responder (b). Combined ROC analyses revealed an elevated AUC of 0.877 (95 % CI 0.793–0.962) with 71.4 % sensitivity and 95.5 % specificity in discriminating non-responder (c)
