Fig. 2.

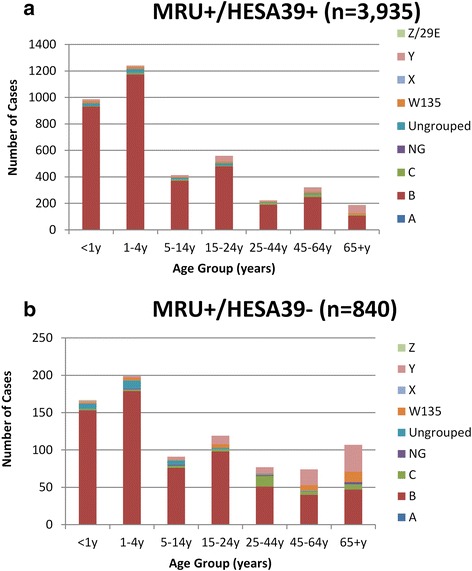
Comparison of age distribution between MRU-confirmed cases in England during 2007-11that linked with a HES A39* diagnosis (Fig. 2a) and those that did not (Fig. 2b). Note the differing Y-axis between the two graphs

Comparison of age distribution between MRU-confirmed cases in England during 2007-11that linked with a HES A39* diagnosis (Fig. 2a) and those that did not (Fig. 2b). Note the differing Y-axis between the two graphs