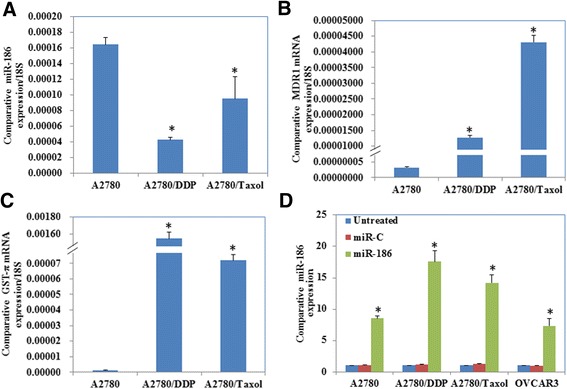
Fig. 1.

MiR-186, MDR1 and GST-π expression in ovarian cancer cell lines. Results of the RT-PCR showed (a) lower miR-186 expression level in A2780/DDP and A2780/Taxol than in A2780, (b) while higher MDR1 and (c) GST-π mRNA expression level in A2780/DDP and A2780/Taxol than in A2780. d MiR-186 transfection significantly induced miR-186 expression. Results are representative of three separate experiments. Data are expressed as the mean ± standard deviation. * P < 0.05
