Fig. 2.

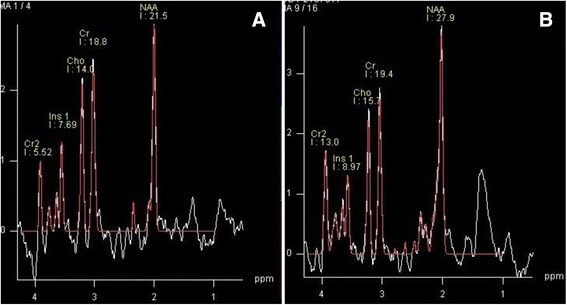
Examples of 1H-MRS spectra acquired from one voxel in D-AD and AD groups. Note the lower NAA/Cr and higher mI/Cr ratios in D-AD subjects (a) compared with nD-AD (b) (CSI, PRESS, voxel size = 10 mm × 10 mm × 15 mm).

Examples of 1H-MRS spectra acquired from one voxel in D-AD and AD groups. Note the lower NAA/Cr and higher mI/Cr ratios in D-AD subjects (a) compared with nD-AD (b) (CSI, PRESS, voxel size = 10 mm × 10 mm × 15 mm).