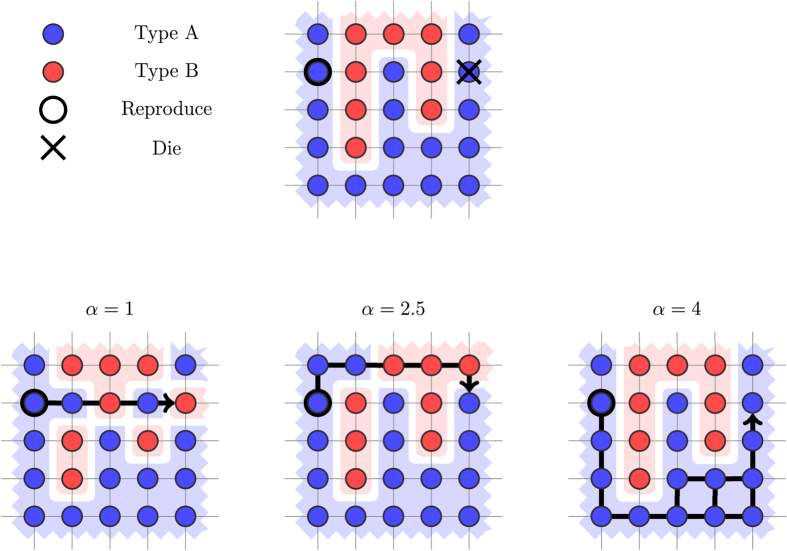
Figure 4. Illustration of the LR shift rule.
The least-resistance path from the reproducing to the dying cell differs as the repulsion force α increases. Initially, we have one cluster of Type B individuals. When we update for α = 1, the result is four clusters of Type B individuals. When we update for α = 2.5, the result is two clusters of Type B individuals. When we update for α = 4, the grid remains unchanged, and we have only one cluster.

